Convert Charts in to another Currency
Overview
The ability to easily convert any chart in to another currency is a powerful feature in Optuma.
With more and more international markets opening up, traders are no longer bound to their local exchange. Most brokers now have hundreds of exchanges on offer, which savvy analysts are taking advantage of more frequently.
A common issue for people trading international markets is the factor of currency fluctuations. A trade someone in Australia places on a US stock, such as Microsoft for example, may show a profit, however, changes in the AUDUSD rate may result in an overall loss (or increase the profit substantially).
Rather than having to manually factor in these changes for international trades, Optuma gives you the option of viewing an international security in your own local currency.
Note
For the currency conversion to work you will need to have Foreign Exchange as one of your data selections.
Below is an example of Microsoft, displayed in both USD and AUD, and showing the 200 day moving average and a trendline from the July high. In USD there followed a lower high, and it’s currently trading below its 200MA, but when displayed in AUD there was a higher high and its still trading above the moving average.

Additionally, the conversion function can be a great way of viewing the market from a different perspective. Below is an example of the Dow Jones Industrial Average Index, priced in USD and in Gold:
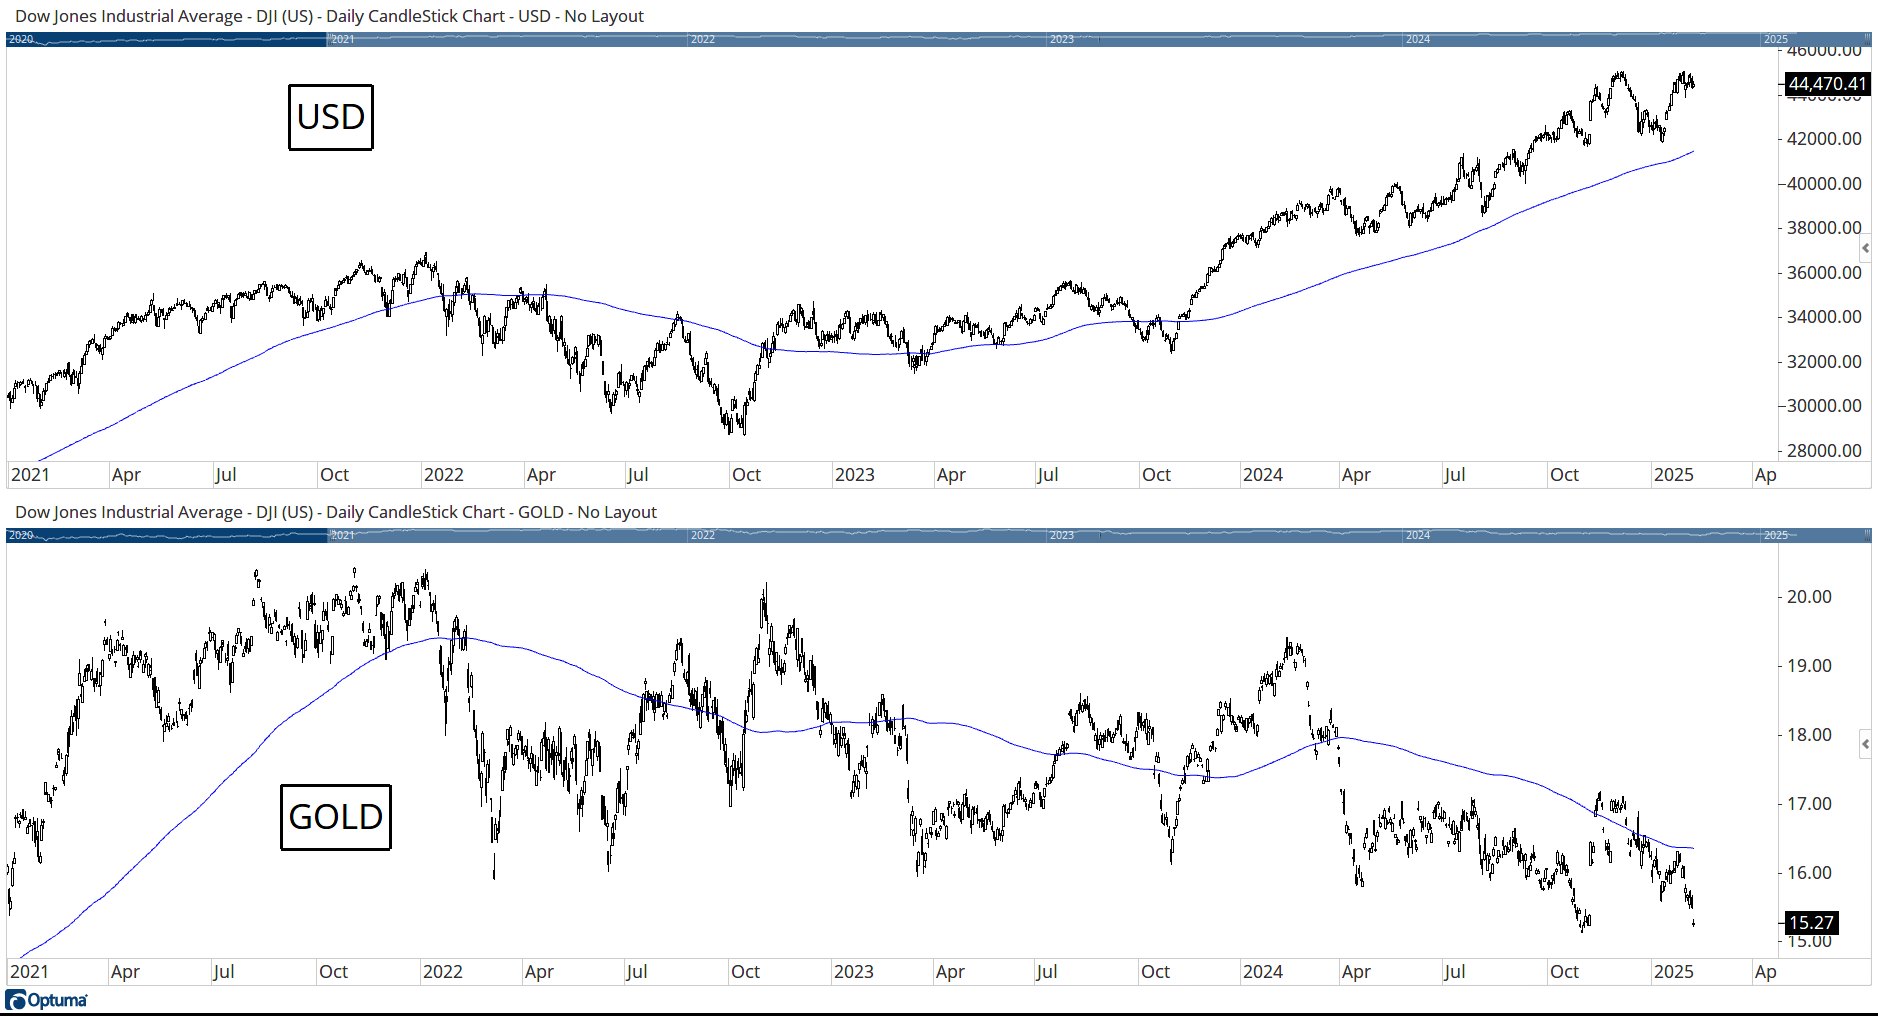
In this example, you can see how the Index itself has been going up and is near all-time highs, but when priced in gold its approaching a long-term low.
Changing the Currency
There are two methods available for adjusting the display currency of a security in Optuma.
Via the Chart Title Bar
The default currency for the chart is displayed as part of the chart’s title bar. Left-clicking on it will display the list of currencies available to view. Note: clicking the arrows icon will show all available currencies, or type the required currency in the search box:
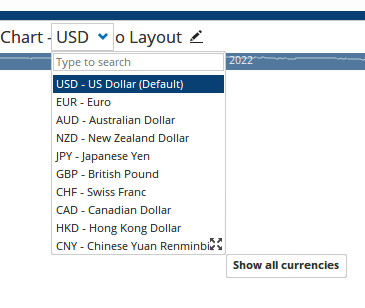
Left-click on the currency in the list and the chart will update.
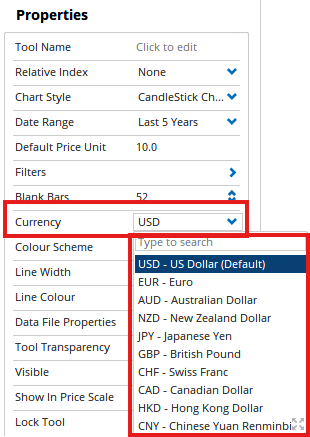
Via the Chart Properties
The currency in use for the chart is also displayed as part of the chart’s Properties. Either in the Properties panel or right-click menu, click on any bar and select the Properties (pencil icon) to change the currency.