Logarithmic Scaling
Logarithmic scaling allows you to see price changes in terms of percentage rather than the absolute price change (also called arithmetic scaling), so that a price change between $1 and $2 (a 100% increase) will have the same vertical distance as a change between $10 and $20, or $50 and $100.
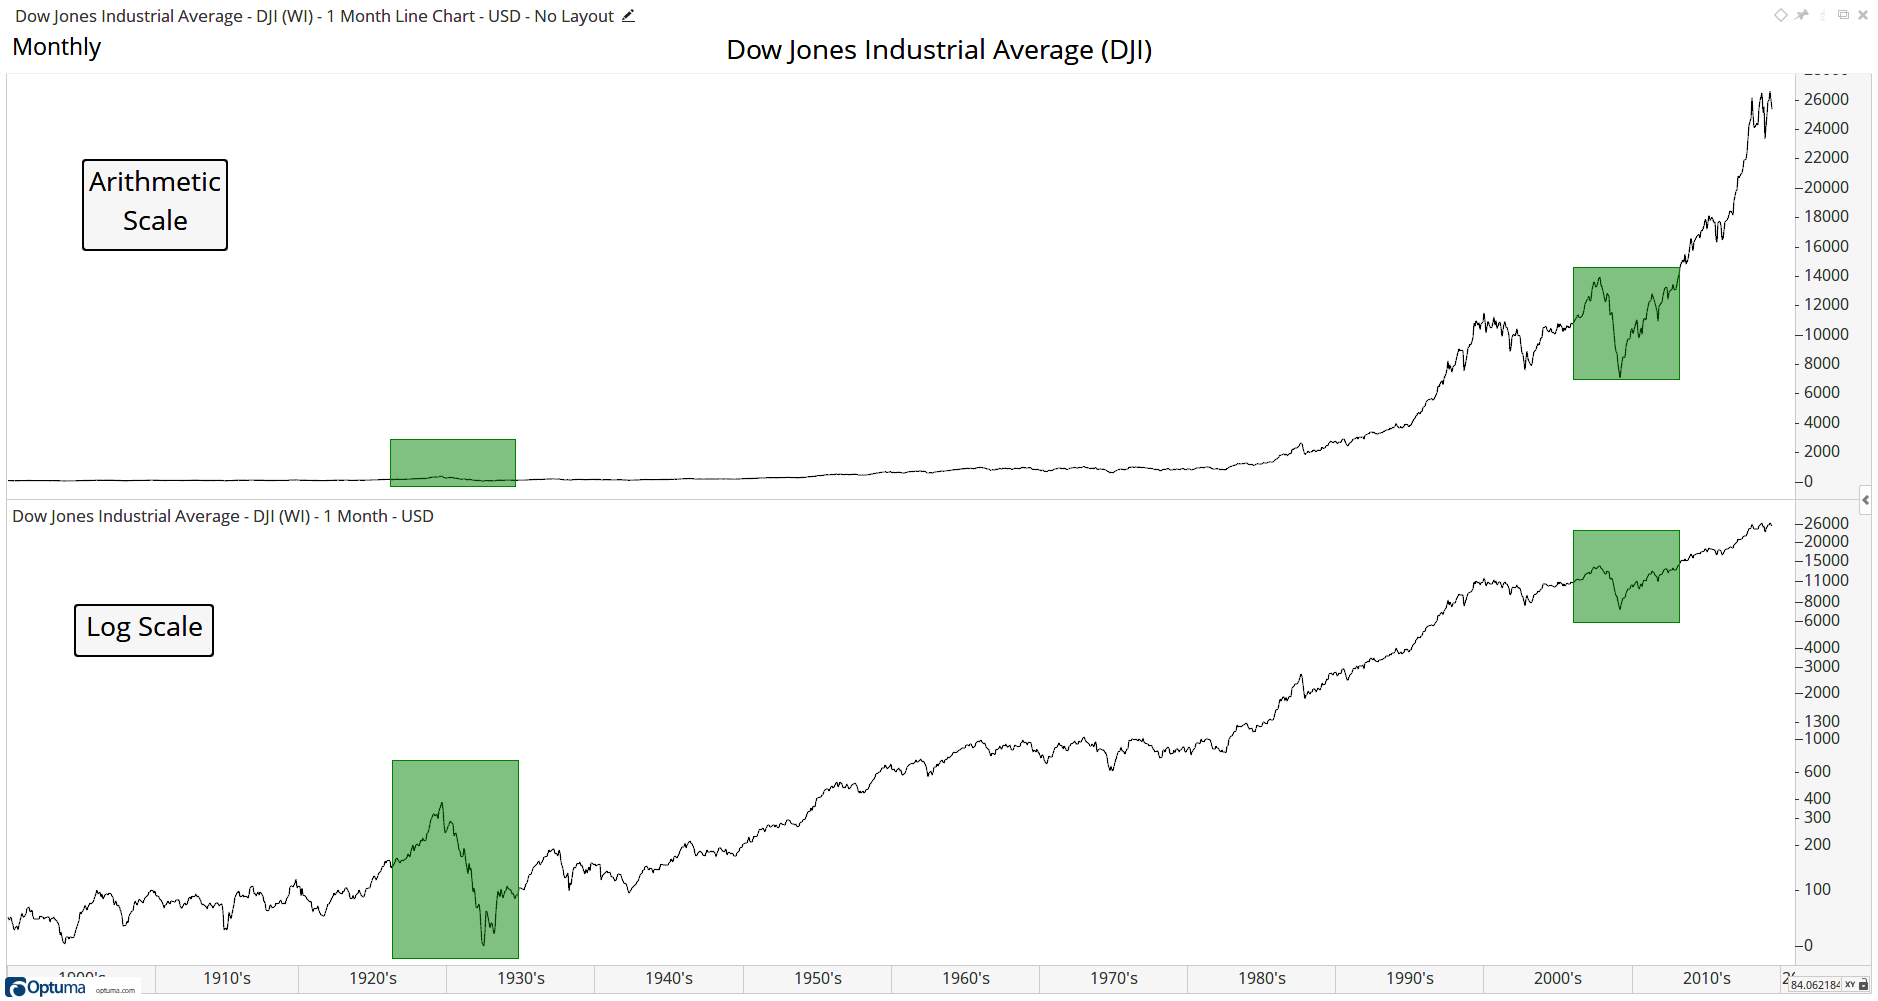
Using log scale (also called semi-log as only one axis is scaled logarithmically) is particularly useful when looking at long term charts that have experienced big price moves. Here’s a look at the Dow Jones index (DJI) going back to 1900, and you’ll notice the 1929 crash is barely noticeable on the arithmetic scale compared with the log scale chart, whereas the 2008 drop appears worse in terms of points, but not percentage:

To enable log scale, tick the Logarithmic Scale option in the chart’s Properties panel or right-click menu:

Using Trend Lines on Log Charts
When applying trend lines to a log scale chart the line will be automatically log-adjusted and will appear straight. If the chart is then changed to standard arithmetic scale the trend line will appear curved until the trend line’s Log Adjust property is disabled:

Likewise, if the trend line is applied to an arithmetic scale chart and log scale is then enabled it will appear curved as it is not log-adjusted:
