Chart Headers
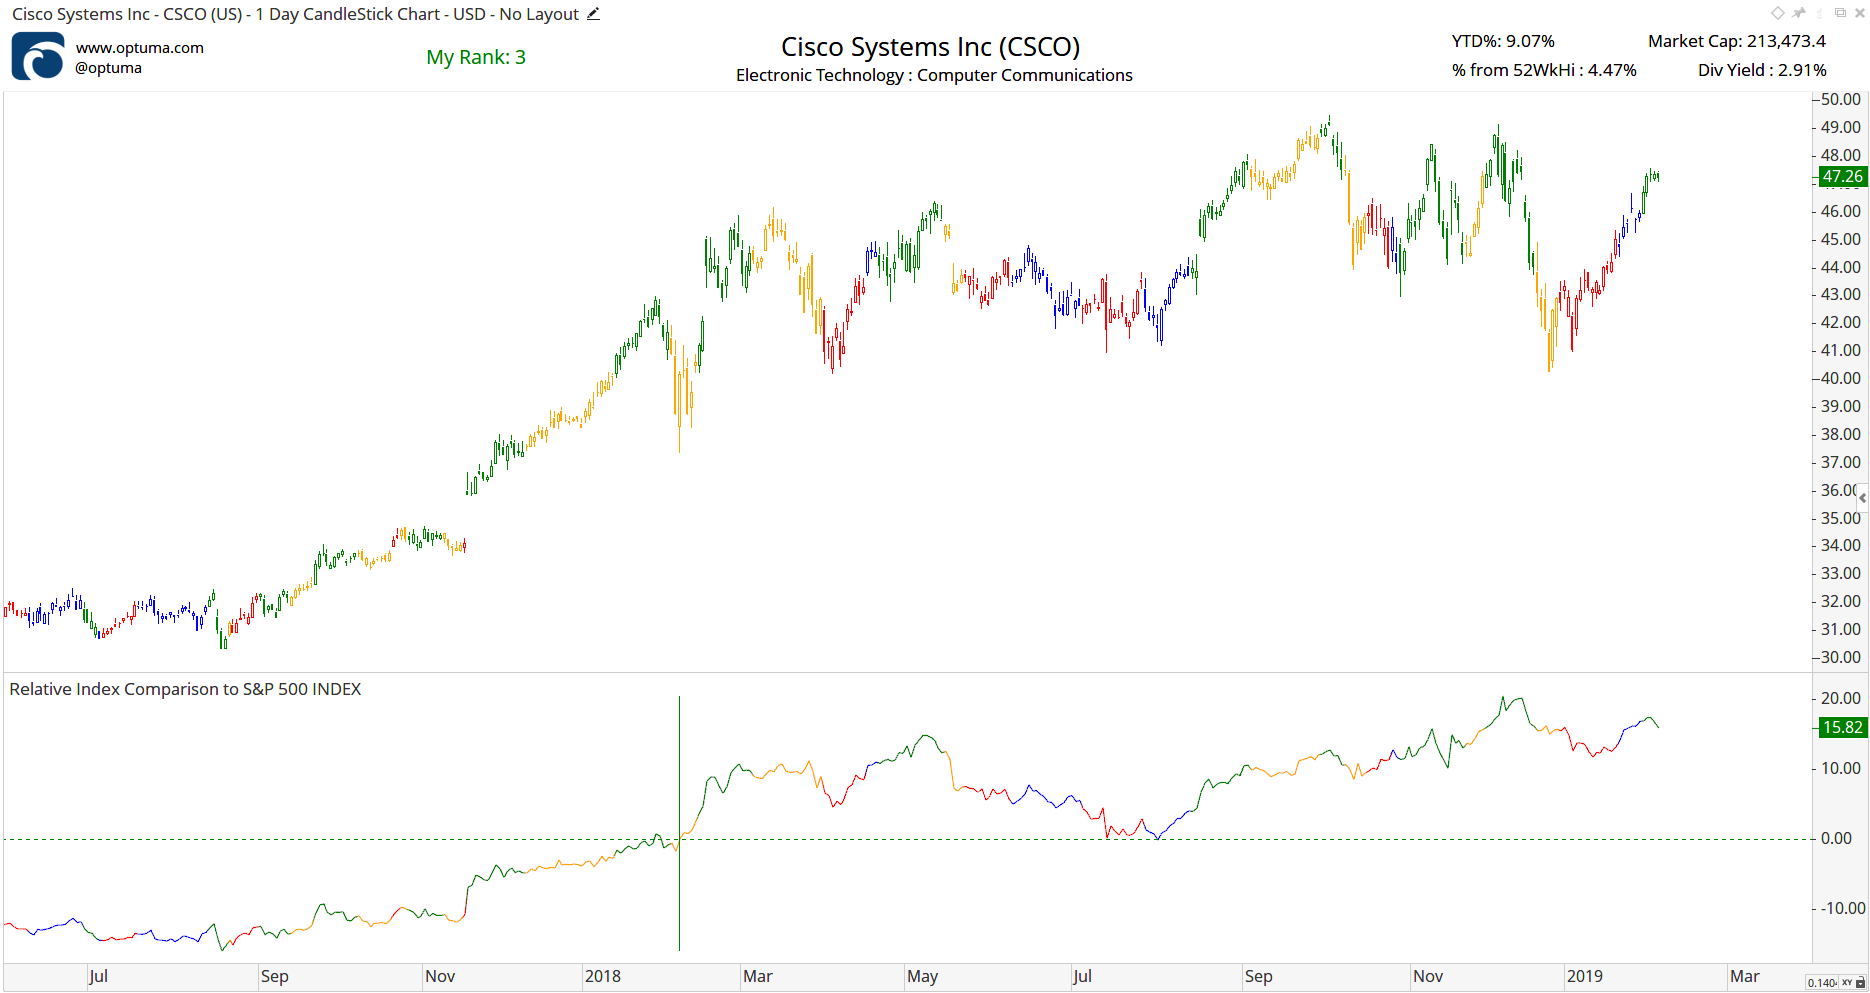
Chart headers are available for clients with access to the Publishing Module which allows for information to be displayed on the chart. It can include text, values of script formulas, and your company logo and contact details - which is particularly useful if you publish reports or post to social media. All the data is completely customisable by the user.

The example above uses our logo, fundamental data, and script formulas to show year-to-date performance, % from the 52 week high, and my custom ranking value.
Video
This video is pulled from the Optuma 101 course that you can access here. This course takes you through the basics of Optuma and helps you get up and running and using Optuma to its full potential. In this video, you will learn how to apply, edit and delete Chart Headers.
Creating a Chart Header
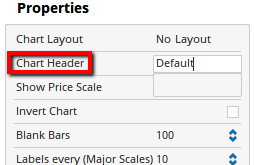
To add the header to your chart click on the Chart Header property and give it a name:

By default, the header will contain the name, code, open/high/low/close, volume and % change.
To move or delete the text fields, click on the pencil icon in the top-right of the header window to enable the edit mode (gridlines to help with alignment will appear).
Right-click on the text to open the properties box.

Adding Information to a Header
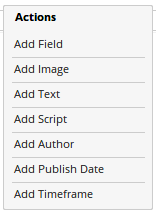
Whilst in the edit mode, right-click anywhere on the header to add either a Field, Image (such as a company logo), Text Box, Script, Author name, Publish Date, or the Timeframe of the chart at the required location.

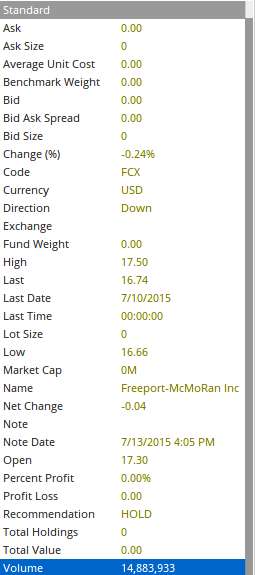
Depending on your data provider the following fields are available:

To exit the edit mode, left-click the pencil icon again.