Anchored Volume-Weighted Average Price (VWAP)


Overview
Note: This tool should not be confused with the traditional intraday VWAP tool that calculates the daily average price for each day based on intraday timeframes.
The Anchored Volume-Weighted Average Price indicator was developed by Brian Shannon, CMT at Alphatrends.net. As Brian describes it, think of the price you may have personally paid for a stock. You tend to base your future decisions about that stock based on your purchase price. We calculate risk from that level and we measure our return based on that entry price. For better or worse, we are “anchored” to the price we paid.
The more participants who are “anchored” to a price level, the greater a move will become when there is a break of that price point. When price breaks a major level of support, the “trapped longs” will have a propensity to look to get out at “breakeven” the supply from these participants helps to form resistance. In a trending market, the classic horizontal support and resistance levels are not always obvious. If we want to measure price memory from an “event” the Anchored Volume Weighted Average Price tool is the most effective means to accomplish this task.
These examples show how price respects the anchored VWAP levels from the first of the year, from the IPO date, and from a significant high:

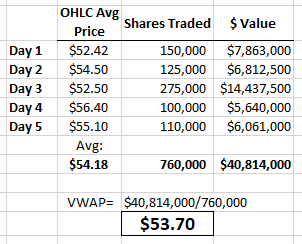
Here’s how the Anchored WVAP is calculated. The simple average price over the 5 days is $54.18, but to calculate the volume-weighted average price we divide the total cumulative value of shares traded ($40,814,000) by the total cumulative number of shares traded (740,000), giving an average VWAP price after Day 5 of $53.70.

To add the tool to your chart, select the tool from the Averages tool group, and left-click on the bar on the chart you wish to calculate the tool from. Optuma will then draw the tool using the default settings.
Scripting Function: AWAP()
This example in a scan will show where the closing price has crossed above or below the AVWAP calculated from the first of the year:
CLOSE() Crosses AVWAP(BACKTYPE=Fixed, DATE=2020-01-01)
For more on scripting with AVWAPs (including scans and automatically applying them to significant highs and lows) see this article.
Forum post on IPO AVWAPs: https://forum.optuma.com/topic/anchored-vwap-scripts-for-ipos/
Actions & Properties
Actions

Copy Data to Clipboard: Will copy the tool’s values to the clipboard which can then be inserted into a spreadsheet, for example, allowing for further analysis.
Add Technical Alert: When selected, a Technical Alert will be created for the selected security.
Add to Toolbar: Adds the selected tool to your custom toolbar.
Apply Settings to All: When multiple Anchored VWAP tools have been applied to a chart, page or workbook, this action can be used to apply the settings of the one selected to other instances of the tool. This is a great time saver if an adjustment is made to the tool - such as line colour - as this allows all the other Anchored VWAP tools in the chart, page or entire workbook to be updated instantly.
Copy Tool: Allows you to copy the selected tool, which can then be pasted onto a different chart window.
Move to Back: If the tool is displaying in front of other tools or indicators clicking this action will move the tool view to the background.
Move to Front: If the tool is displaying behind other tools or indicators on the chart, clicking this action will bring the tool to the forefront.
Restore Default Settings: Click this action if you have adjusted the default settings of the tool, and wish to return to the standard properties originally installed with Optuma.
Save Settings as Default: If you have adjusted any of the tool’s properties (colour, for example) you can save the adjustments as your new default setting. Each time you apply a new Anchored VWAP to a chart, the tool will display using the new settings.
Delete: Deletes the tool from the chart.
Properties

Tool Name: Allows you to adjust the name of the tool, as it’s displayed in the Structures Panel.
Start Date: Allows you to manually adjust the start date the Anchored VWAP calculates from.
Calc Using: This option is used to determine which components of the data are used in calculating the Anchored VWAP. You can choose from, Open Price, Closed Price, High Price, Low Price, HL (High + Low / 2), HLC (High + Low + Close / 3), OHLC (Open + High + Low + Close / 4), OC (Open + Close / 2) or Median.
Plot Style: Allows you to change how the tool is displayed on your chart. There are 6 options available: Line, Dot, Histogram, Step, Shaded, Shaded Step.
Offset: Moves the tool forward or backwards in time. The offset is measured in bars, so a value of 2 will push the tool forward 2 bars and -2 will move the tool back 2 bars.
Tool Transparency: Use this slider bar to adjust the transparency of the tool. Moving the slider to the left will increase the transparency of the tool.
Visible: Un-tick this checkbox to hide the tool from the chart.
Show in Price Scale: When selected the current Anchored VWAP value will be displayed in the Price Scale.