COT Stochastic Oscillator

Overview
The COT Stochastic Oscillator is a concept suggested by Murry A Ruggiero in his 1997 book Cybernetic Trading Strategies. The source data for the tool is the COT (Commitment Of Traders) Report released by the Commodity Futures Trading Commission (CFTC). That report lists the number of outstanding futures contracts (Open Interest) of a number of US Futures/Commodities and breaks that report into three categories:
- Commercials: The main producers and consumers of commodities. eg Wheat farmers are producers and bread makers are consumers.
- Large Speculators (non commercial).
- Small Speculators.
Note
To have access to this indicator you must have both the COT Data and USA Futures enabled on your account. Log in to your account page via the Online User Portal to modify your data subscription. To view the oscillator open the continuous futures contract chart first, eg W2Spot, GC2Spot, CL2Spot and then select the COT Stochastic Oscillator from the Tools menu. The relevant COT data will then be downloaded and added to the chart.
Large and Small Speculators have the same mandate: they buy and sell long and short contracts seeking to profit from changes in the value of the commodity. The difference between large and small is simply the number of open contracts they hold. Both Commercials and Large Speculators have an obligation to report their positions to the CFTC. The numbers ascribed to the Small Speculators is the residual after the other groups have reported.
In the report, each line is the net number of Long Contracts - Short Contracts. So if a group was bullish, we would see a net long (or positive) value.
Ruggiero suggested that the actual level of the components of a COT report were less important than whether the levels were near recent highs or lows. To create an indicator around this, Ruggiero suggested a Stochastic calculation which is simply a ratio of the current value within the range of values from the lowest to the highest in the lookback period. The lookback period is defined by the Base Stochastic and represents the number of weeks the stochastic calculation is performed over (the tool uses 52 weeks as a default).
This tool provides the results of the stochastic calculations for each of the groups in the COT Report.

To add the tool to your chart, select the tool from the Data tool group, and left-click on the chart to add the tool. Optuma will then draw the tool in a window below the chart using the default settings.
Scripting Function: COTO()
Actions & Properties
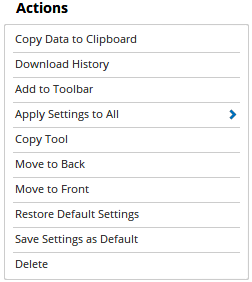
Actions

Copy Data to Clipboard: Will copy the tool’s values to the clipboard which can then be inserted into a spreadsheet, for example, allowing for further analysis.
Download History: Allows all historical data to be downloaded for the tool (requires an Optuma data subscription).
Add to Toolbar: Adds the selected tool to your custom toolbar.
Apply Settings to All: When multiple COT Oscillator tools have been applied to a chart, page or workbook, this action can be used to apply the settings of the one selected to other instances of the tool. This is a great time saver if an adjustment is made to the tool - such as line colour - as this allows all the other COT Oscillator tools in the chart, page or entire workbook to be updated instantly.
Copy Tool: Allows you to copy the selected tool, which can then be pasted onto a different chart window.
Move to Back: If the tool is displaying in front of other tools or indicators clicking this action will move the tool view to the background.
Move to Front: If the tool is displaying behind other tools or indicators on the chart, clicking this action will bring the tool to the forefront.
Restore Default Settings: Click this action if you have adjusted the default settings of the tool, and wish to return to the standard properties originally installed with Optuma.
Save Settings as Default: If you have adjusted any of the tool’s properties (colour, for example) you can save the adjustments as your new default setting. Each time you apply a new COT Oscillator to a chart, the tool will display using the new settings.
Delete: Deletes the tool from the chart.
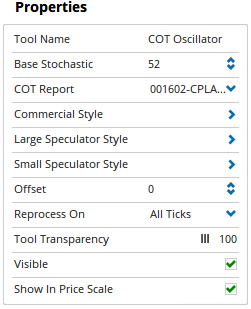
Properties

Tool Name: Allows you to adjust the name of the tool, as it’s displayed in the Structure Panel.
Base Stochastic: Allows you to adjust the number of time periods used to calculate the base stochastic.
COT Report: This drop-down list includes all items with available COT data if you wish to change the report that has been automatically downloaded. The list will display the reference code, and short name and can be searched (go to the COT website to view the complete list of reference codes).
Commercial Style: This option expands to display the following options for the Commercial Style line of the COT Indicator:
- Plot Style - Allows you to adjust the display style for the tool. There are 8 options available: Line, Dot, Histogram, Step, Shaded, Shaded Step, Bars, Candles.
- Line Style - When the Plot Style is set to Line, Histogram, Step, or Shaded Step, this property allows you to adjust the type of line displayed. There are 8 options available: Solid, Dots, Dash, Dash Dots, Long Dash, Long Dash Dot, Long Dash Dot Dot, Stippled.
- Line Width - Allows you to adjust the width of the line for the tool. Moving the slider bar to the right increases the thickness of the line.
- Colour Scheme - Allows you to choose between the following colour schemes for the tool: Copy Colours from Price Chart, Single Colour, Positive / Negative, Custom.
- Line Colour - When the Colour Scheme is set to Single Colour, this property allows you to adjust the colour of the line. Clicking on the drop down arrow will display a colour swatch. Locate the desired colour and left-click it once to select it.
- Positive - When the Colour Scheme is set to Positive/Negative, this property allows you to adjust the colour of the tool when it is above the Positive / Negative Barrier. Clicking on the drop down arrow will display a colour swatch. Locate the desired colour and left-click it once to select it.
- Negative - When the Colour Scheme is set to Positive / Negative, this property allows you to adjust the colour of the tool when it is below the Positive / Negative Barrier. Clicking on the drop down arrow will display a colour swatch. Locate the desired colour and left-click it once to select it.
- Positive / Negative Barrier - When the Colour Scheme is set to Positive / Negative, this property allows you to adjust the barrier value. The default value is 0.00.
- Custom Colour Scripts - When the Colour Scheme is set to Custom, this property allows you to set the colour of the tool according to your scripts. For more information on this, please click here. Clicking on the drop down arrow will display a colour swatch. Locate the desired colour and left-click it once to select it.
- Fill Up / Down Barrier - When the Plot Style is set to Shaded, this property allows you to adjust the barrier value. The default value is 0.00.
- Fill Up Colour - When the Plot Style is set to Shaded, this property allows you to adjust the fill colour of the tool when it is above the Fill Up / Down Barrier. Clicking on the drop down arrow will display a colour swatch. Locate the desired colour and left-click it once to select it.
- Fill Down Colour - When the Plot Style is set to Shaded, this property allows you to adjust the fill colour of the tool when it is below the Fill Up / Down Barrier. Clicking on the drop down arrow will display a colour swatch. Locate the desired colour and left-click it once to select it.
- Fill Transparency - When the Plot Style is set to Shaded, use this slider bar to adjust the transparency of the filled portion of the tool. Moving the slider to the left will increase the transparency.
- Visible - Un-tick this checkbox to hide the line from the chart.
Large Speculator Style: This option expands to display the properties as shown for the Commercial Style line.
Small Speculator Style: This option expands to display the properties as shown for the Commercial Style line.
Offset: Moves the tool forward or backwards in time. The offset is measured in bars, so a value of 2 will push the tool forward 2 bars and -2 will move the tool back 2 bars.
Reprocess On: Allows you to adjust when the tool reprocesses. There are 4 options available: All Ticks, Every 30 Sec, Every 5 Min, Never. For more information, click here.
Tool Transparency: Use this slider bar to adjust the transparency of the tool. Moving the slider to the left will increase the transparency of the tool.
Visible: Un-tick this checkbox to hide the tool from the chart.
Show In Price Scale: When selected the current COT Oscillator value will be displayed in the Price Scale.