Reverse RSI
Overview
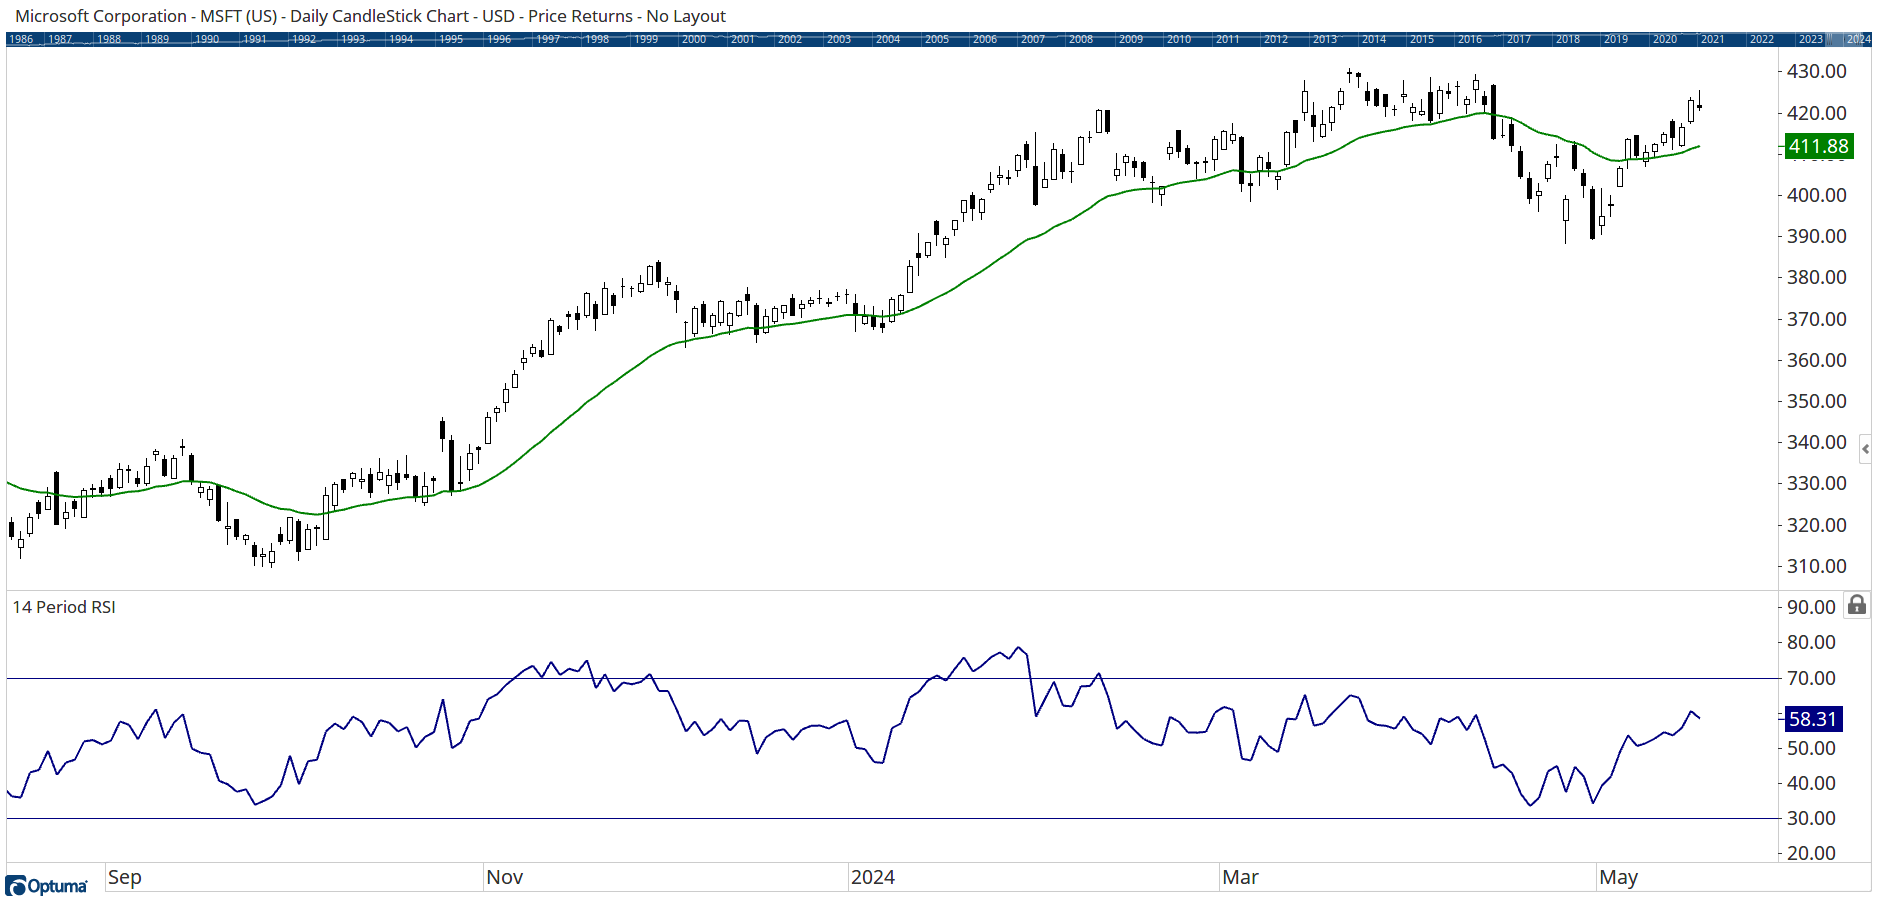
Based on the work of Giorgos Siligardos, the Reverse RSI tool plots the value on the chart at which the price needs to be to have a certain RSI value. This can be used to provide potential support and resistance levels based on RSI.
By default the tool uses a 14 period RSI value of 50. In this example of Microsoft the price is above the green Reverse RSI line, meaning the current RSI(14) is above 50. As we can see in the RSI below the chart the current value is 58.31, so for MSFT to reach an RSI(14) level of 50 would require the price to fall to 411.88:
To add the tool to your chart, select it from the Price tool group, and left-click on the chart and Optuma will then draw the tool using the default settings.
Scripting Function: REVRSI()
Actions & Properties
Actions
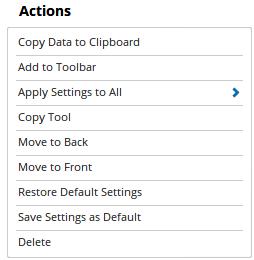
Copy Data to Clipboard: This will copy the tool’s values to the clipboard which can then be inserted into a spreadsheet, for example, allowing for further analysis.
Add to Toolbar: Adds the selected tool to your custom toolbar.
Apply Settings to All: When multiple Reverse RSI tools have been applied to a chart, page or workbook, this action can be used to apply the settings of the one selected to other instances of the tool. This is a great time saver if an adjustment is made to the tool - such as line colour - as this allows all the other Reverse RSI tools in the chart, page or entire workbook to be updated instantly.
Copy Tool: Allows you to copy the selected tool, which can then be pasted onto a different chart window.
Move to Back: If the tool is displaying in front of other tools or indicators clicking this action will move the tool view to the background.
Move to Front: If the tool is displaying behind other tools or indicators on the chart, clicking this action will bring the tool to the forefront.
Restore Default Settings: Click this action if you have adjusted the default settings of the tool, and wish to return to the standard properties originally installed with Optuma.
Save Settings as Default: If you have adjusted any of the tool’s properties (colour, for example) you can save the adjustments as your new default setting. Each time you apply a new Reverse RSI to a chart, the tool will display using the new settings.
Delete: Deletes the tool from the chart.
Properties
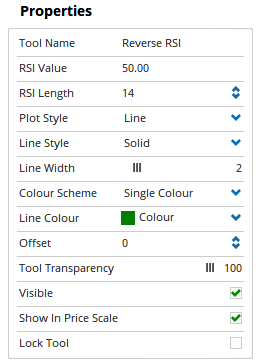
Tool Name: Allows you to adjust the name of the tool, as it’s displayed in the Structures Panel.
RSI Value: The target RSI value (50 by default) used to calculate the price level. Change to 30 to find the level at which the stock will be oversold.
RSI Length: The number of bars used in the RSI calculation (14 by default).
Plot Style: Allows you to change how the tool is displayed on your chart. There are 6 options available: Line, Dot, Histogram, Step, Shaded, Shaded Step.
Line Style: The Line Style property allows you to adjust the type of line displayed. There are 8 options available: Solid, Dots, Dash, Dash Dots, Long Dash, Long Dash Dot, Long Dash Dot Dot, Stippled.
Line Width: Allows you to adjust the width of the line. Moving the slider bar to the right increases the thickness of the line.
Colour Scheme: Allows you to choose between the following colour schemes for the tool: Copy Colours from Price Chart, Single Colour, Positive / Negative, or Custom.
Line Colour: Allows you to select the colour of the line. Clicking on the drop down arrow will display a colour swatch. Locate the desired colour and left-click it once to select it.
Offset: Moves the tool forward or backwards in time. The offset is measured in bars, so a value of 2 will push the tool forward 2 bars and -2 will move the tool back 2 bars.
Tool Transparency: Use this slider bar to adjust the transparency of the tool. Moving the slider to the left will increase the transparency of the tool.
Visible: Un-tick this checkbox to hide the tool from the chart.
Show in Price Scale: When selected, the current Reverse RSI value will be displayed in the Price Scale.
Lock Tool: This checkbox allows you to lock the tool so that the properties position on the chart can not be altered.