Stochastic RSI
Overview
The stochastic tool is a momentum oscillator between 0 and 100 that compares the closing price to a range of prices over a period of time. The Stochastic RSI differes in that it calculates the range of the RSI instead of price.
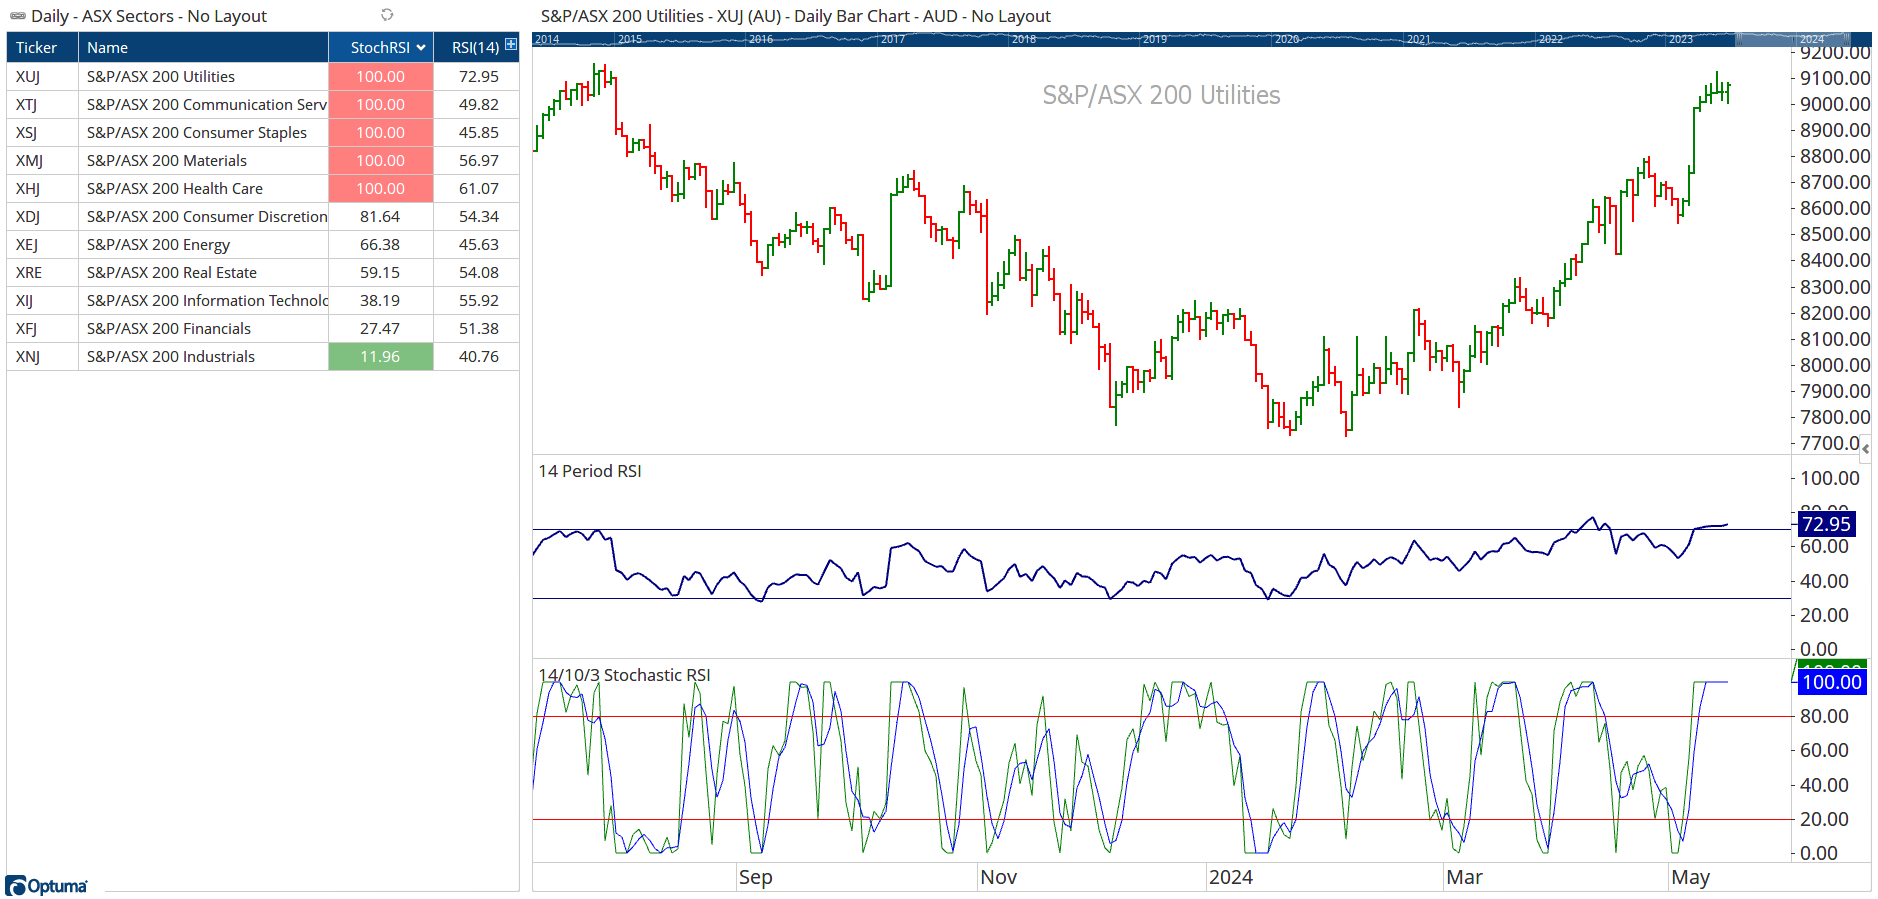
By default the tool uses a 14 period RSI value of 50 with a 10 day lookback period. A value of 100 means that the RSI is at its highest level over the lookback period, and zero is at its lowest level. When above 80 its considered overbought, and 20 oversold.
In this example, five of the ASX sectors have their highest RSI(14) level over the last 10 days, with only Industrials (XNJ) in oversold Stochastic RSI territory:
To add the tool to your chart, select it from the Price tool group, and left-click on the chart and Optuma will then draw the tool using the default settings.
Scripting Function: STOCHRSI()
Actions & Properties
Actions
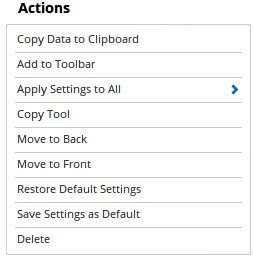
Copy Data to Clipboard: This will copy the tool’s values to the clipboard which can then be inserted into a spreadsheet, for example, allowing for further analysis.
Add to Toolbar: Adds the selected tool to your custom toolbar.
Apply Settings to All: When multiple Stochastic RSI tools have been applied to a chart, page or workbook, this action can be used to apply the settings of the one selected to other instances of the tool. This is a great time saver if an adjustment is made to the tool - such as line colour - as this allows all the other Stochastic RSI tools in the chart, page or entire workbook to be updated instantly.
Copy Tool: Allows you to copy the selected tool, which can then be pasted onto a different chart window.
Move to Back: If the tool is displaying in front of other tools or indicators clicking this action will move the tool view to the background.
Move to Front: If the tool is displaying behind other tools or indicators on the chart, clicking this action will bring the tool to the forefront.
Restore Default Settings: Click this action if you have adjusted the default settings of the tool, and wish to return to the standard properties originally installed with Optuma.
Save Settings as Default: If you have adjusted any of the tool’s properties (colour, for example) you can save the adjustments as your new default setting. Each time you apply a new Stochastic RSI to a chart, the tool will display using the new settings.
Delete: Deletes the tool from the chart.
Properties
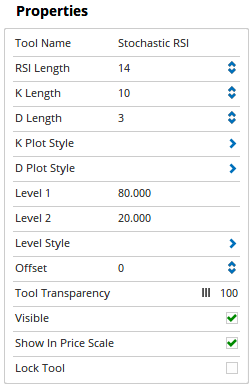
Tool Name: Allows you to adjust the name of the tool, as it’s displayed in the Structures Panel.
RSI Length: The number of bars used in the RSI calculation (14 by default).
K Length: The number of bars used in the stochastic lookback period (10 by default).
D Length: The number of bars used in the moving average of the stochastic (3 by default).
K Plot Style: How the K line is displayed on your chart, including line style, colour, and width.
D Plot Style: How the D line is displayed on your chart, including line style, colour, and width.
Level 1: Sets the overbought level.
Level 2: Sets the oversold level.
Level Style: How the Level lines are displayed on your chart, including line style, colour, and width.
Offset: Moves the tool forward or backwards in time. The offset is measured in bars, so a value of 2 will push the tool forward 2 bars and -2 will move the tool back 2 bars.
Tool Transparency: Use this slider bar to adjust the transparency of the tool. Moving the slider to the left will increase the transparency of the tool.
Visible: Un-tick this checkbox to hide the tool from the chart.
Show in Price Scale: When selected, the current Stochastic RSI values will be displayed in the Price Scale.
Lock Tool: This checkbox allows you to lock the tool so that the properties position on the chart can not be altered.