Watchlist - Overview
Overview
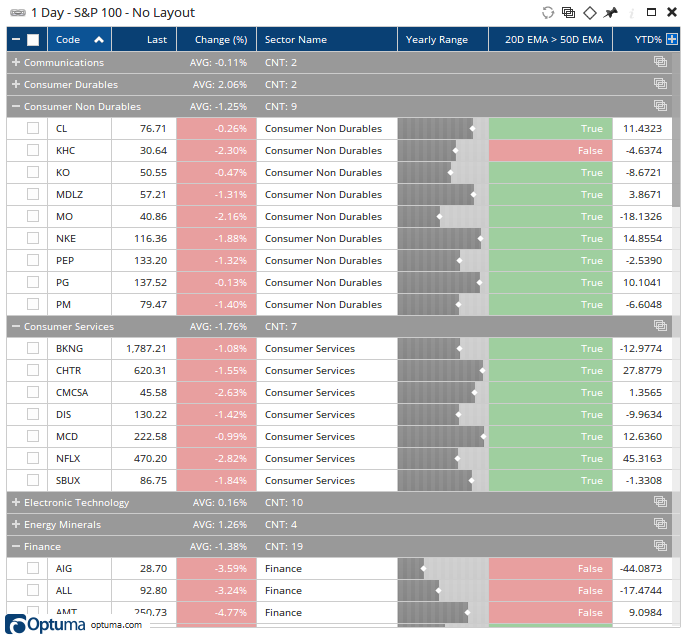
Watchlists in Optuma provide you with the raw and important information for a number of securities on one screen. Any fundamental or technical value or condition can be added to a custom column using the Optuma Scripting Language, such as 52 Week High, sector, market cap, moving average slope direction, weekly RSI value, % above 50MA, Relative Rotation Graph® values - basically anything you can think of. When real-time data is enabled, the information displayed on the Watchlist will dynamically update with each tick.

As you click on a ticker in the list any chart of the same tab will update accordingly.
Professional and Enterprise Services clients can automatically group the list (eg by Sector, or by decile) and summarise each one:

Video
Intro to Watchlists
This video is pulled from the Optuma 101 course that you can access here. This course takes you through the basics of Optuma and helps you get up and running and using Optuma to its full potential. This video will cover how to create and open a watchlist.
Using Watchlists
This video is also pulled from the Optuma 101 course and will take you deeper into the flexibility of watchlists and show you how you can use watchlists to help further your analysis and make the most out of Optuma.
Additional Information on Watchlists
Grouping - Professional & Enterprise Services only