Time Price Measure


Overview
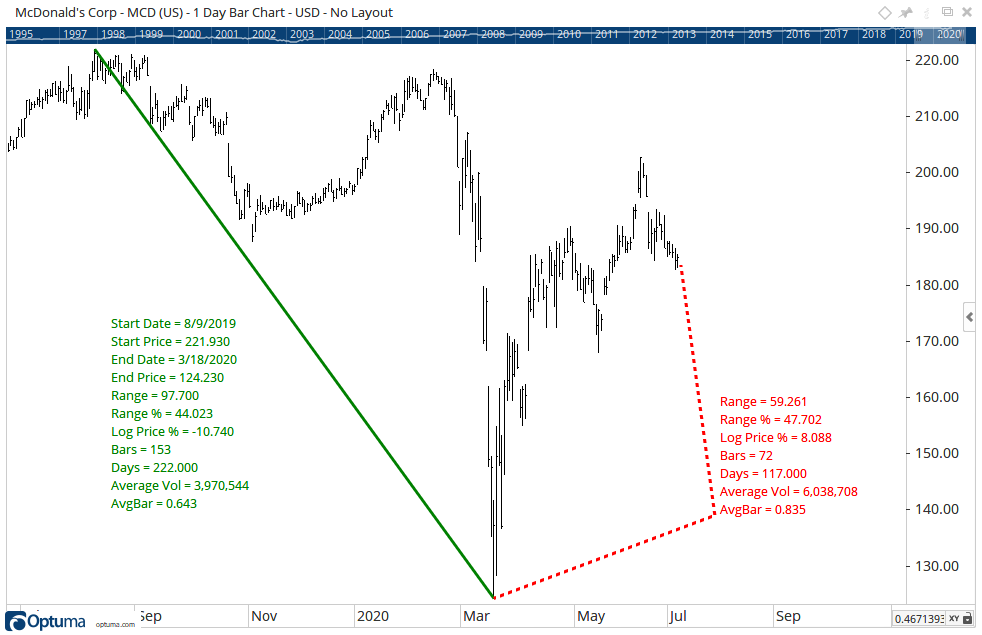
The Time Price Measure tool calculates time counts and price level information between two selected points on the chart. It is similar to the Time Price Labels tool but draws a line connecting the two points, and allows for custom labels to be added using a scripting formula. The tool can either connect the two points directly with a straight line as per the example below in green, or draw lines via the label (in red).

To add custom labels click the Show Labels property and click the ‘+’ to add a label. In this example, AvgBar has been added which is the Range (abs(P2-P1)) divided by the number of bars (abs(I2 - I1)) to calculate the average price move per bar between the two points.
abs(P2 - P1) / abs(I2 - I1)

Gann users wishing to know the Price Unit being used can add a label with the UNIT expression:

To add the tool to your chart, select the tool from the Gann tool group, and left-click on the first bar you want to calculate the tool from, and then click on the second bar. Optuma will then calculate the measurements between the two points using the default settings.
Actions & Properties
Actions

Add to Toolbar: Adds the selected tool to your custom toolbar.
Apply Settings to All: When multiple Time Price Measure tools have been applied to a chart, page or workbook, this action can be used to apply the settings of the one selected to other instances of the tool. This is a great time saver if an adjustment is made to the tool - such as line colour - as this allows all the other Time Price Measure tools in the chart, page or entire workbook to be updated instantly.
Copy Tool: Allows you to copy the selected tool, which can then be pasted onto a different chart window.
Move to Back: If the tool is displaying in front of other tools or indicators clicking this action will move the tool view to the background.
Move to Front: If the tool is displaying behind other tools or indicators on the chart, clicking this action will bring the tool to the forefront.
Restore Default Settings: Click this action if you have adjusted the default settings of the tool, and wish to return to the standard properties originally installed with Optuma.
Save Settings as Default: If you have adjusted any of the tool’s properties (colour, for example) you can save the adjustments as your new default setting. Each time you apply a new Time Price Measure to a chart, the tool will display using the new settings.
Delete: Deletes the tool from the chart.
Properties

Tool Name: Allows for the name of the tool to be changed, as displayed in the Structure Panel.
Show Labels: Allows you to enable / disable various labels as well as add your own custom labels using scripts by pressing the blue + button:
- Show All
- Start Date
- Start Price
- End Date
- End Price
- Range: The difference in price between the two points.
- Range %: The percentage difference in price between the two points.
- Log Price %: The logarithmic percentage difference in price between the two points.
- Bars: The number of bars between the two points.
- Days: The number of calendar days between the two points.
- Solar Degrees: The distance between the two points measured in solar degrees.
- Average Volume
- Cumulative Volume
- Price Unit: This can be manually added using the expression UNIT.
Show Line: Uncheck this box to remove the line connecting the selected points.
Show Script Labels: This checkbox allows you to include a scripted value in the Time Price Measure label.
Formula: If the Show Script Label checkbox is ticked, this property will appear. Clicking the … icon will open the script manager, where you can select a saved script or enter a new script.
Expression: If the Show Script Label checkbox is ticked, this property will appear. This property controls how the script value is handled between the two selection points of the TPM tool. S1 = the script value at the first point, S2 = the script value at the second point. By default the expression will be set to S2 - S1.

The expression label of the TPM above is showing the percentage difference (24.74%) of a 50SMA from the start and end point of the TPM tool using the MA(BARS=50) script formula and the (S2-S1)/S1 * 100 expression.
Lock Label to Line: Check the box to draw lines from the selected points to the label.
Alignment: The label can be placed in different positions in relation to the Time Price Measure line. There are 8 options available: Top Left, Top Right, Centre Top, Bottom Left, Bottom Right, Centre Bottom, Centre Left and Centre Right.
Font Size: Allows you to adjust the size of the text displayed for each price label. Moving the slider bar to the right increases the font size.
Line Style: The Line Style property allows you to adjust the type of line displayed. There are 8 options available: Solid, Dots, Dash, Dash Dots, Long Dash, Long Dash Dot, Long Dash Dot Dot and Stippled.
Line Width: Allows you to adjust the width of the line. Moving the slider bar to the right increases the thickness of the line.
Line Colour: Allows you to select the colour of the label. Clicking on the drop down arrow will display a colour swatch. Locate the desired colour and left-click it once to select it.
Tool Transparency: Use this slider bar to adjust the transparency of the tool. Moving the slider to the left will increase the transparency.
Visible: Un-tick this checkbox to hide the tool from the chart.