Vector

Overview
The Vector is a geometric tool based on the work of Scott Hathaway of Pattern to Profit. For more information, please click here.

By selecting two points and thus forming a vector which connects them, this tool identifies the price movement, time movement, and thus the price/time ratio. In addition, the vector’s angle is given. (Note: The angle only has meaning if the price-lock ratio is set. In the above example, the vector ratio - 74.129 points per week - is used for the price-lock ratio, which sets the vector at a geometric 45 degrees.)
A grid can also be generated (by ticking the Show Grid property) as a natural extension from the two selected points, to identify potentially important locations in price and time (small arrows in the above example). The current price is just underneath such an intersection.
The price/time ratio is particularly helpful in determining a price-lock ratio for geometry, such as in Relative Charting, where all resulting geometry is ‘seen’ from the vector’s perspective at 45 degrees.
The next example demonstrates the effectiveness of this approach by a manually drawn Geometric Fan whose angles dissect the vector’s 45-degree line by five, offering traditional fan analysis:

Video
Actions & Properties
Actions

Add Line Alert: Creates an alert based on the selected line. See here for more information on Line Alerts.
Add to Toolbar: Click this action to add the selected Vector to your custom toolbar.
Apply Settings to All: When multiple Vectors have been applied to a chart, page or workbook, this action can be used to apply the settings of the one selected to other instances of the tool. This is a great time saver if an adjustment is made to the tool - such as line colour- as this allows all the other Vectors in the chart, page or entire workbook to be updated instantly.
Copy Tool: Allows you to copy the selected Vector, which can then be pasted onto a different chart window.
Inverse Vector: Inverts the selected Vector by either Vector Ratio or 45 degrees.
Move to Back: If the tool is displaying in front of other tools or indicators clicking this action will move the tool to the background.
Move to Front: If the tool is displaying behind other tools or indicators on the chart, clicking this action will bring the tool to the forefront.
Price Flip: Duplicates the Vector based on price.
Restore Default Settings: Click this action if you have adjusted the default settings of the Vector, and wish to return to the standard properties originally installed with Optuma.
Save Settings as Default: If you have adjusted any of the Vector properties (colour, for example) you can save the adjustments as your new default setting. Each time you apply a new Vector to a chart, the tool will display using the new settings.
Time Flip: Duplicates the Vector based on time.
Rotate 90 Degrees: Moves the Vector through 90 degrees.
Delete: Delete the Vector from the chart.
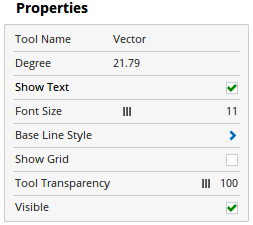
Properties

Tool Name: Allows you to adjust the name of the tool, as it’s displayed in the Structure Panel.
Degree: Manually change the angle of the Vector.
Show Text: Untick to hide the text label.
Font Size: Allows you to adjust the size of the text displayed for each label used in the text. Move the slider bar or roll the mouse wheel to increase the font size.
Base Line Style: The Line Style property allows you to adjust the type of line displayed (eg dashes, dots), line width, colour, transparency and extensions.
Show Grid: Tick this box to show a grid based on the Vector.
Grid Line Style: Displays when Show Grid is selected. Allows the grid line style, width, colour and transparency to be adjusted.
Tool Transparency: Use this slider bar or roll the mouse wheel to adjust the transparency of the tool. Moving the slider to the left will increase the transparency of the tool.
Visible: Un-tick this checkbox to hide the tool from the chart.